






Big Geodata
Cartography and the politics of visibility
7 min

This story explains how mapmaking has been used as an instrument of power and how mapping alternatives can make the previously unseen visible.
There's always politics involved when it comes to shaping and visually representing the world. Politics determines what is made visible, legible, and authoritative, and what is rendered as irrelevant. And maps, as a tool of political power, play a crucial role in this process by defining both the physical (spatial existence) and ontological (what is recognised as real and legitimate).
The process of making maps, or cartography, operationalises this politics throughout data collection, classification, symbolization, scale, and even omission.
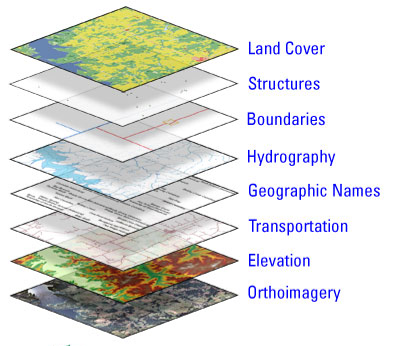
Base Data Layers of The National Map. From The National Map Content, by U.S. Geological Survey, n.d. (https://www.usgs.gov/media/images/national-map-content). In the public domain.
Since the discipline, and consequently the techniques, of cartography serve institutional processes through which spatial knowledge is produced, within this text, maps refers specifically to state-sanctioned, institutional, and technocratic cartographic products (e.g. cadastral maps, administrative boundaries, infrastructure maps), not to subjective or experiential representations such as mental maps, artistic cartography, or indigenous cosmographies, which are discussed later as alternatives.
Maps are often perceived as mere tools depicting physical reality, a neutral backdrop.
Yet, the choices made during mapping determine what is recognised as real, shaping how people see the world and how knowledge is constructed from that point onward.
Institutional cartography has historically claimed objectivity while serving specific political and economic interests.
The history of cartography has long been intertwined with power, and maps are anything but neutral.
Maps are a direct reflection of the decision on whose land exists, whose communities are counted, and whose lives matter.
Colonial powers understood that the maps depicting boundaries, land tenure and territorial control were central to their governance and utilised cartography for their conquests.
In India, the British conducted the Great Trigonometrical Survey (1802-1871) and subsequent cadastral surveys transformed land into taxable, governable property, enabling revenue extraction and administrative control.
In French Indochina, colonial maps replaced fluid, overlapping indigenous territorial practices with rigid administrative borders aligned with colonial governance needs.
In Japanese-occupied Korea, cartographic surveys imposed land registration systems that restructured land ownership and facilitated extraction.
Boundaries, cadastral surveys, and resource maps were all technologies of rule that rendered colonised territories legible, comparable, and exploitable. They were instruments of power, depicting manifestations of the coloniser's wishes and priorities, and never an objective representation.
Over time, indigenous knowledge, local practices, and alternative ways of understanding territory were delegitimised and erased when they did not fulfil the colonisers' agenda. As a result, maps continued to be constructed to carry the coloniser's legacy.
These legacies did not disappear with decolonisation.
Institutional cartography continues to perpetuate systemic inequity by determining who is seen in the world. It dictates whose voice is heard, whose knowledge counts, and whose reality is recognised during decision-making in the socioeconomic and political sphere.
Visibility is power, and funding is required to collect that data to make things visible on a map. Being on the map confers legitimacy, access to resources, and political recognition that is robbed from those who are not present on the map.
However, the decisions about what data to collect, update, and maintain often only include privileged areas with economic or strategic value. Roads, formal housing, and registered infrastructure are prominently mapped, while informal settlements, indigenous territories, and marginalised communities are left off the grid or generalised.
The communities that are not visible on the map are excluded from conversations shaping policy, governance, aid distribution, and re-imagination of a better future, often leaving them disempowered and socially erased.
Even in the case of humanitarian aid, informal settlements absent from official maps are routinely excluded from infrastructure investment and disaster risk planning.
Beyond political intent, exclusion is embedded in a spatial model that abstracts territory into fixed coordinates and bounded units.
Indigenous cartographies record what this model leaves out.
Marshallese navigators wove stick charts from coconut midribs to model how islands disrupt the flow of ocean swells and currents. A navigator in training studied these charts on land and then learned to feel the same swells through the motion of a canoe at sea.

A Marshallese stick chart. The sticks model swell patterns around islands. From Marshall Islands Stick Chart, Meddo Type [Model], ca. 1920, Library of Congress, Geography and Map Division.
Late Postclassic and early colonial Maya manuscripts contain cosmograms, graphic models of the cosmos. Pages 75 and 76 of the Madrid Codex, for example, combine time and space in a single plan.
In the Canadian Arctic, a network of trails once linked most Inuit settlements, and knowledge of these routes and their place names passed orally from one generation to the next. Anthropologist Claudio Aporta argues that parts of Inuit culture are better understood as a way of living through movement along these trails.
None of these maps fixes territory in coordinates; each records how people move through, use, and understand space.
If the process of creating maps has long served power, they can also serve people.
Across the world, new approaches are challenging the idea that only centralised and institutional authorities can define space.

Participants Drawing a Map During a Participatory Mapping Workshop. From Participatory Mapping [Photograph], by K. Q. Bumstead, n.d.
Participatory and community-driven mapping reframe cartography as a collective process of knowledge creation, revealing what traditional maps erased.
These approaches include bottom-up mapping, mental maps, participatory GIS, and indigenous cartographies that centre lived experience and local knowledge.
This co-creation of knowledge, done in collaboration with both the marginalised and larger community, promotes inclusivity and opens the space for multiple realities to coexist within shared landscapes.
Indigenous land claims in the Olympic Peninsula, community mapping projects in Amsterdam’s peripheries, and countless initiatives across the Global South are all using cartography to assert their existence.
Such approaches, often called counter-mapping, challenge dominant narratives and redefine what counts as real by reclaiming agency. They pluralise spatial knowledge and use cartography as a tool of empowerment for advocacy and dialogue.
The future of mapping lies in recognising that spatial knowledge is plural, and that more equitable worlds begin by drawing them together.
Want to learn more about this topic? Check out our free Geoversity course, GeoTechE: Geotechnology Ethics, which includes a unit on Counter-mapping.
Login and start learning!