


Disaster Risk
Rebuilding After an Earthquake in Nepal
3 min
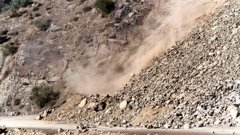
Landslide susceptibility is basically the probability of a landslide occurring. Obviously, the probability of a landslide occurring on a steep slope is much greater than on flat ground. That's something we can commonly perceive. However, by viewing this phenomenon as a dynamic process, we can actually see the susceptibility changing in time. We can compute different factors for that, such as rainfall. When there is a lot of rain and a slope becomes saturated with water, it cannot hold the moisture content forever. At a certain moment it will just slide down. In other words, in such a situation the probability of a slope failing or a landslide occurring increases. Slope failing is a hazard that can easily turn into disaster, especially where large populations or certain industries are in the vicinity of unstable slopes. That is why it’s important to be able to estimate how unstable slopes are at any given moment. A dynamic landslide susceptibility model can help to achieve that.
In my ITC Master’s thesis, I described a statistical model capable of predicting rainfall-induced landslides in space and time. The model involves several variables which define how dangerous a slope is, such as the steepness of the slope angle, the type of vegetation and direction of slope. To those variables I added rainfall as a triggering factor. Adding this factor makes the model a dynamic tool that can help to predict what's going to happen in a month's time or so, depending on what kind of rain forecast information you have.
For rainfall forecasts, many different sources are available. For instance, NASA uses GPM (Global Precipitation Measurement), which can help integrate rain forecast in near-time up to 90 minutes. Based on this, NASA also has a model that can predict landslides every 30 minutes on a global scale. Our approach builds on the same model with modifications of dynamic trigger, that is the novelty of this work. On Google Earth Engine, with our model you can actually input any kind of forecast data for rainfall available on the platform. We have different satellites collecting different data which is feasible for different kinds of places on the globe. For example, some satellite data might work really well for Asia, whereas for America other data might be more suitable.
During my time at ITC I translated the above theory into a practical application based on the Google Earth engine (see figure 1).
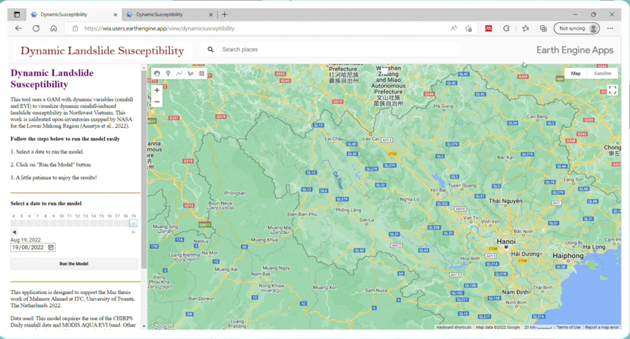
All my remotely sensed info data is collected in the Google Earth engine, and I can access it using the Google Earth engine catalogue. I use this information to solve a part of my model right away, which reduces computation time, and then add dynamic rainfall information. With the date slider on the left, you can select any date you want. You can visualize landslide susceptibility up to six weeks before the current date because the rainfall forecast used in this case (CHIRPS) is available on the platform with a lag time. Once a date is selected and the application is run, the model will do everything on its own and, depending on the probability threshold of a slope failing, produce a warning or a ‘no-warning’.
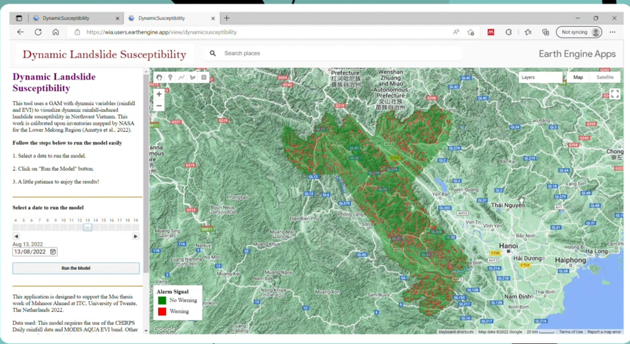
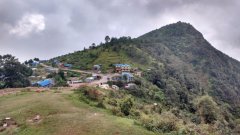
Visualizing the results will take some time because of the many mapping units involved. Figure 2 shows what the model will look like in the end. Red marks represent a warning signal, whereas green ones are relatively safe areas. If you should live near one of the red areas, it would be wise to investigate how intense the rainfall is; how close you are to the hazard area and in which direction the possibly failing slope is oriented. In my research, I focused on Northwest Vietnam, not only because of data availability but also because it is a highly vulnerable region, with many storms, tropical cyclones and different rainfall systems coming in.
This is a very accessible app with a cool interface, designed to be practical for any end user, including absolute laymen. It provides a graphical representation that makes it easy to understand what’s going on in the area you investigate.
For those interested in the underlying science, here’s a link to my thesis: Towards near real-time forecasting of rainfall-induced landslides.
The link to the application is: https://mahnoorahmed5593.users.earthengine.app/view/dynamicsusceptibility
Login and start learning!