


Climate Change
The Social Impact of Climate Overshoot
3 min
In this long read, learn about extreme weather events that are likely to be associated with climate change.
In the summer of 2021, a dramatic heat wave occurred in Alberta, Canada. Temperatures of close to 50 degrees centigrade were observed. During this heatwave, the small village of Lytton was completely burned down because of a self-ignited forest fire. This event could not have occurred unless climate change was involved.
In the same year, at the crossroads of the Netherlands, Germany and Belgium, a rainstorm stayed in place for 48 hours, releasing an enormous amount of rain that caused damages in excess of 30 billion euros and more than 200 fatalities. The probability of this extreme event also appears to be increased due to climate change.
However, these events cannot be taken as unambiguous evidence of climate change - forest fires and floods have taken place in the past, after all. But there is more happening in nature than only these extreme weather events. Jan Willem Erisman - professor of biology and environmental studies at Leiden University - has shown that the population of a wide variety of mammals, birds, and insects has decreased by almost 70% since 1970. This is a shocking finding. We humans are part of the cycle of life; if animals disappear, this will influence our lives and the probability of surviving as well.
Biodiversity loss and other effects related to climate change show that the issue is more complex than just a changing weather system. Jan Willem Erisman also argued how land use has changed in recent decades, from a varied use of the land to a well-organized system focused on producing a lot of food, leaving very few animal species left. His data shows that the population of birds that fly over farming areas in the Netherlands have decreased by a factor of three since 1960. This is just one of many examples showing that climate change and our land use are both affecting the environment.
In setting out to prove unambiguously that our world is experiencing climate change, we can point to these extreme weather events but, as noted before, it's known that extreme weather has always occurred on this planet. The definitive proof that the climate change is indeed happening on our planet can be obtained from observing the ice sheets.
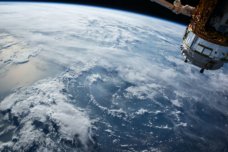
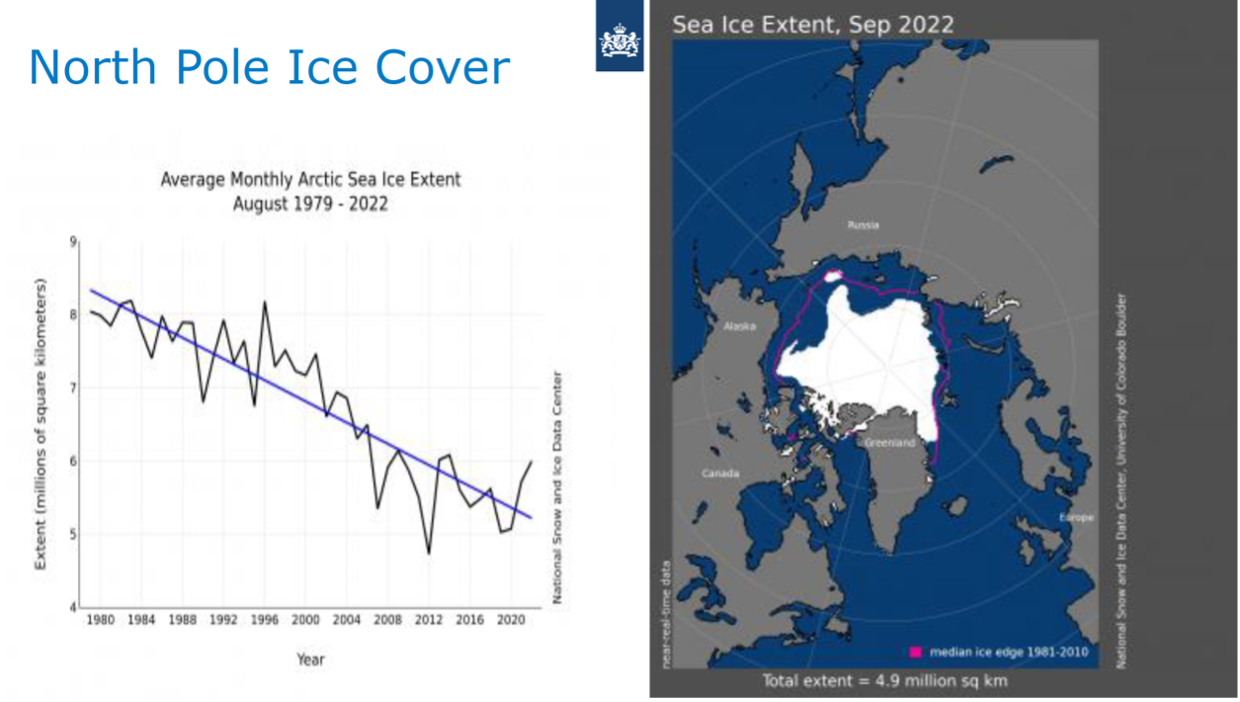
Satellite observations of the North Pole in September 1984 and in 2016 show a dramatic difference in ice cover. The ice sheet has become thinner and has a much smaller extension. The reduced area is the equivalent of roughly four to five times the surface area of France.

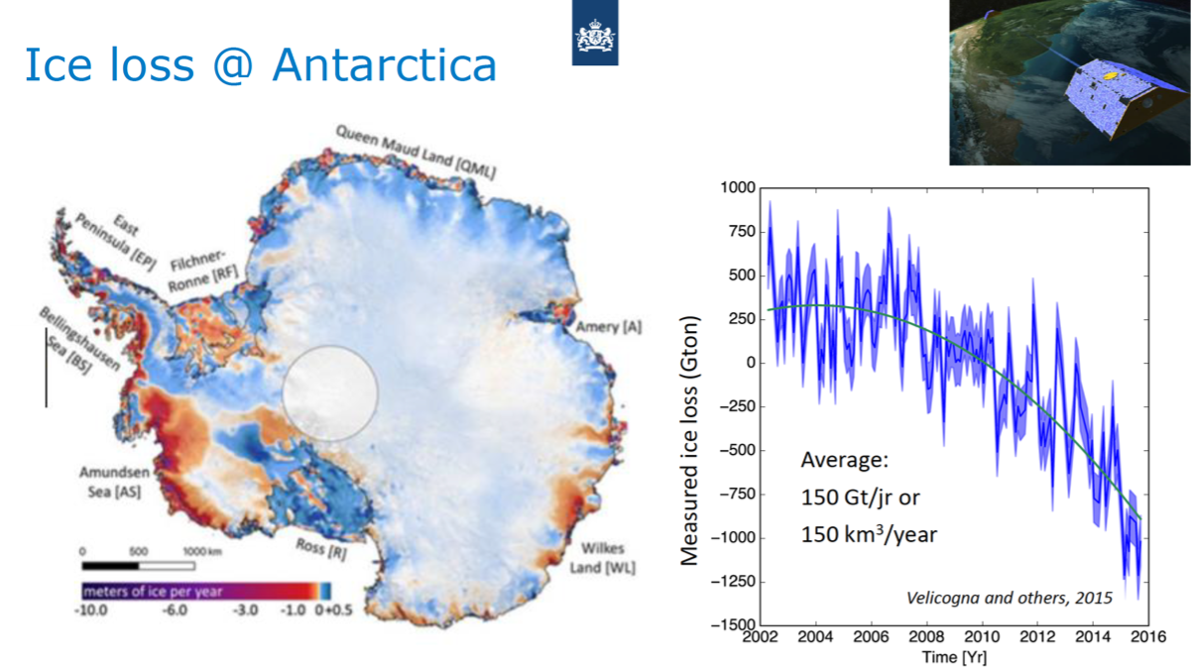
Something similar is happening in Antarctica at the South Pole. There is, however, one key difference. The North Pole is an ocean, so the ice cover is floating in the sea. A reduction in the ice there means that the aerial extent of the ice is getting smaller. The South Pole, on the other hand, is a continent, where ice has been built up on top of a large area of land, up to three kilometers in altitude. To observe for changes, we can’t look at the aerial extension of the ice sheet, but through satellite observation we can look for a possible reduction of its thickness. The colour red in the picture below means there is a reduction in the thickness of the ice sheet in that area.
The extent of this reduction is a little less than at the North Pole because the average temperature at the South Pole is substantially lower. Nevertheless, we observe dramatic effects happening. If all the ice on the South Pole melts - which can only happen at a timescale of a thousand years - the sea level would rise by 65 meters.
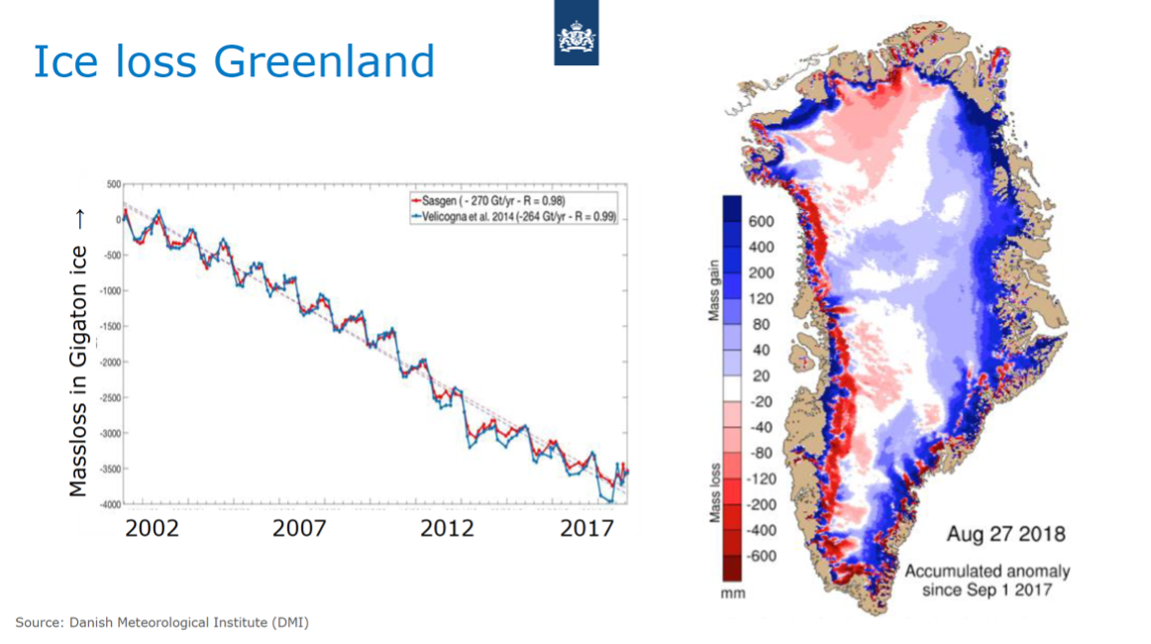
The third ice sheet we can observe is Greenland. The effect is more subtle because there is more precipitation - rain and snow - but still a systematic reduction of the ice sheet can be observed.
The unambiguous conclusion is that, everywhere on our planet, ice sheets are melting. This can only have one cause: the average global temperature must be rising.

Worldwide measurements of the global temperature indeed show a substantial increase. However, the change in temperature is not uniform over the globe. On average the rise is larger at the continents and somewhat less at the oceans. Most remarkable is the temperature change at North Pole, which is more than twice as large as compared to the world average due to a well-known feed-back loop: if the ice covers gets smaller, less sun light is reflected by the North Pole while more sun light is absorbed by the black ocean waters. As a result, the local sea water temperature is getting higher, which leads to increased melt. Such effects make it tricky to evaluate an average value for the global warming, as temperature rise is non-uniform. Several scientific groups have been comparing numbers with each other for decades, coming up with an average of 1.1 degrees Celsius temperature rise as compared to the period 1850 - 1900. The storyline so far is quite simple: we see the ice melting due to rising worldwide temperatures. But this leaves one question open: why is the temperature rising?
The answer is the enhanced greenhouse effect. There has always been a certain amount of CO2 in our atmosphere - typically between 200 and 300 ppm. This amount of CO2 is essential to sustain a living habitat on our planet - without it, temperatures would be much colder, and it would be very difficult to sustain life as we know it. The basic greenhouse effect is caused by the difference in wave length of the incoming solar radiation on the one hand – which is heating up our environment – and the wave length of the heat radiation emitted by the warmed environment (i.e. land and sea). The difference in wave length has a significant consequence: whereas visible light can pass the atmosphere (including a layer of CO2 ), heat radiation can be trapped by a CO2 molecule. The CO2 molecule (and other greenhouse gasses such as methane) re-emits the radiation in all directions, implying that part of it is sent backward to the ground surface. In this way part of the heat radiation is captured in the troposphere, causing global warming. If the CO2 layer is increased in size, more of the radiation will be reflected back to the Earth and our environment will get hotter. The relative increase of the CO2 concentration in the atmosphere is called the enhanced greenhouse effect.
The green house effect can be compared to the effect of the windows in a room. If the thickness of the windows increases, so too will the temperature inside the room. A window – like the CO2 layer in the atmosphere - is transparent to visible light but it is not transparent to heat. If we increase the thickness of the glass in the room or the thickness of the CO2 in the atmosphere, the temperature will go up.
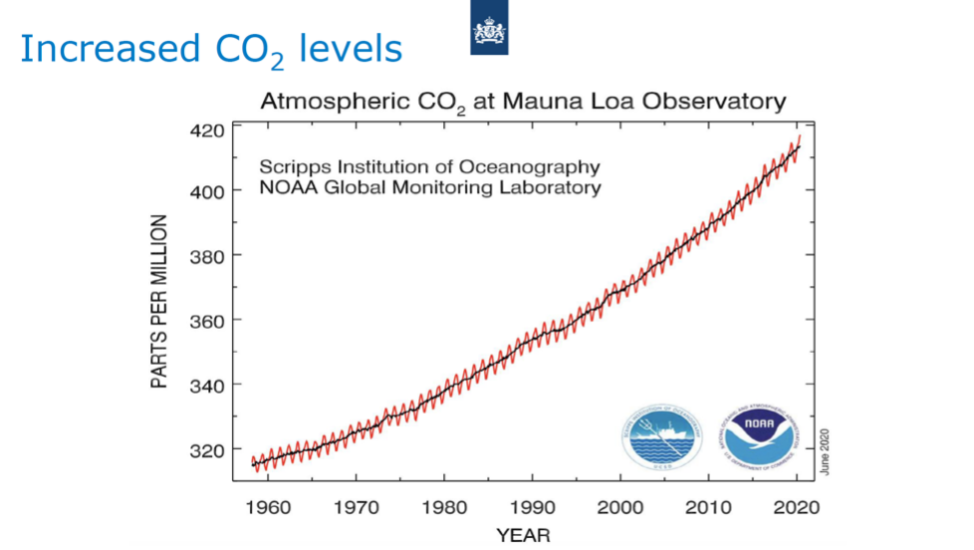
Over the last 60 years, scientists have observed at various measuring locations an increase in the CO2 content of our atmosphere. The most famous point of observation is the Mauna Loa Observatory in Hawaii, where scientists started measuring CO2 levels due to a volcanic eruption. The measurements continued over time and from 1963 to 2020 their data shows an almost linear increase in CO2 levels - reaching more than 400 parts per million in recent years. We are increasing the emission of CO2 and other greenhouse gasses through production processes in industry, domestic heating, driving cars, and other processes in which we burn fossil fuels. This enhances the greenhouse effect and thus leads to increased temperatures – as shown in the graph. This – and other scientific data – have now led to the unambiguous conclusion that human activity has led to global warming.
However, also in the distant past CO2 levels on our planet have not always been constant. Scientists have evaluated CO2 levels from hundreds of thousands of years ago by extracting small air bubbles from ice cores in Greenland and Antarctica. From this, gradually fluctuating CO2 levels were observed that can be attributed to the varying distance between the sun and the northern hemisphere – where most of the continents are located. This distance is varying because the earth shows a very slow precession in its orbit around the sun, resulting in a slow nudging of its axis of rotation. Because of this effect the continents received less sun light during certain periods, resulting in fewer life forms and less CO2 emissions. This in turn led to a cooling of the troposphere and is commonly know as an ice age.
But since the beginning of the industrial revolution, humans started burning fossil fuels to manufacture all kind of products – heat engines, cars, trains, refrigerators, etc. As a result, massive amounts of CO2 were released in the atmosphere. The increase of CO2 levels was particularly dramatic in the last 60 years because of the strong economic growth worldwide. As a result, global warming is increasing in parallel, with an average temperature increase of about 1.2 degrees as compared to the 19th century, as reported (annually) by the World Meteorological Organization.
This isn't a surprise for scientists. As early as 1912, the New Zealand newspaper The Rodney & Omatea Timesaccurately described the issue of global warming:
Decades later, in 1968, a group of scientists came together and formed the Club of Rome. In 1972, they published a very significant report about to the effect of human activities on the environment of our planet. Three years later, in 1975, scientists S. Manabe and R. Wetherald carried out the first model calculation in order to assess the effect of a doubling of CO2 levels in our atmosphere. These two scientists forecasted a temperature rise at the North Pole substantially higher than at the equator, a cooling of the stratosphere and other features of global warming that are presently confirmed by the meteorological observations.
Although we are still refining our knowledge of extreme weather events, forecasting, early warnings and tipping points, the basics concepts of global warming have already been known for many decades - if not more than a century.
More than a billion people on Earth are living in harbor cities and in coastal areas, where the elevation of the land is often less than one meter above sea level. As the climate warms and the ice melts, as discussed in the previous section, more water will flow into the oceans, increasing the volume of the oceans and resulting in a worldwide sea level rise. Sea level rise threatens a large fraction of the human population. We must know what to expect in the coming years to address this issue.
Let’s take a look at the basics. Ice sheets and glaciers are melting, which leads to the flow of more fresh water into the oceans and a rise in sea levels. But there is another effect - if the atmosphere warms, then the sea will warm as well. This happens because of a normal exchange of heat between the atmosphere and the sea. If you go to the sea in the summer, the sea water temperature is quite a bit higher than during the winter. However, when a material is heated, it expands – this includes water, so a warmer sea also requires more space. Therefore, the increase in sea water temperatures also leads to a higher sea level.
An official report from the Intergovernmental Panel on Climate Change (IPCC) in 2021, along with accumulated data since 1900, shows that the sea level has already risen by 20 centimeters in the last 120 years. Rich countries can handle this amount of sea level rise, which as such is no reason for concern. But this is already more difficult for the so-called Small-Island-States (mostly located in the Pacific). So how will sea level rise develop in the next 100 years?
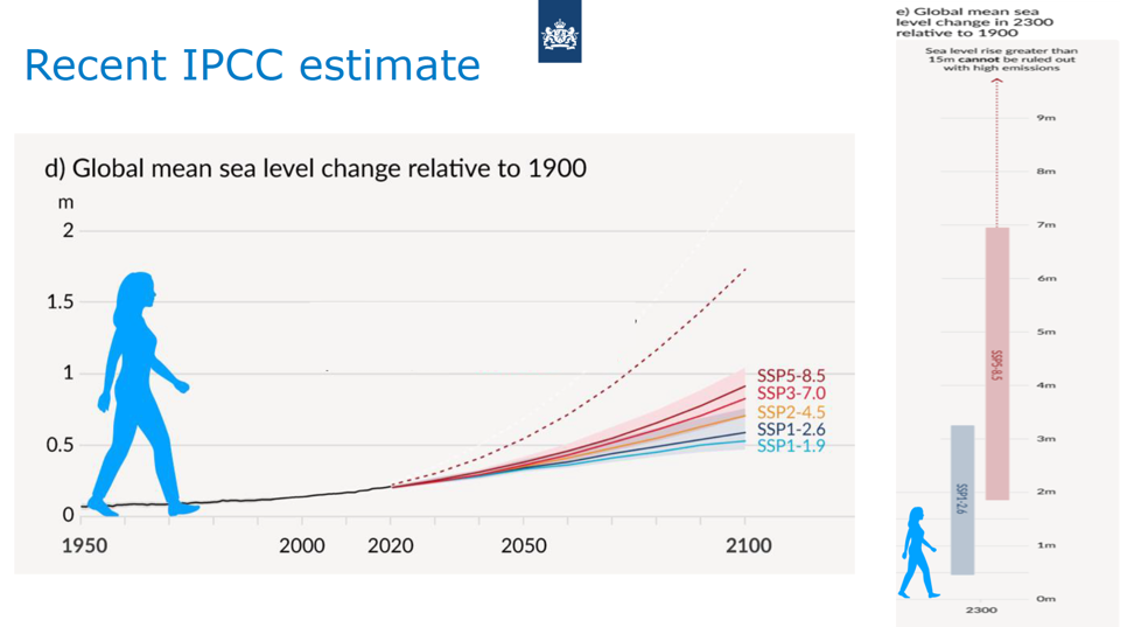
According to the most recent IPCC report, sea level rise will reach a value of between 50 and 100 centimeters. Even with these numbers, low-lying developed countries like the Netherlands will be able to handle such a sea level rise by making taller dikes and changing the locking systems in front of the harbors. However, such a sea level rise would be a disaster for many of the small islands in the Pacific, where the average altitude can be as low as 40 centimeters.
The 2021 report of the International Panel on Climate Change (IPCC) includes, for the first time, an assessment of reaching of a possible tipping point in Antarctica. This could happen because warming seas and increased precipitation may cause melts at the bottom of an ice sheet and cracks at the top. Water in the cracks of the ice sheet will increase the probability that the entire ice shelf will break and slide off into the ocean and thereby increase the sea level. This phenomenon was not included in past reports because it turned out to be very hard to assess its probability. However, because of the high risk, such a worst-case scenario has been included in the report. The issue is that, although the probability is low, such a turning point in Antarctica could lead to a sea level rise of 15 meters in 200 years’ time. This could be very threatening for most of the low-lying countries in the world. Although such an event may be beyond our time horizon, it will not be beyond that of future generations, for whom we bear a responsibility.
We have talked about extreme weather events such as forest fires, droughts and floods. The question for this section is, “how can we explain the occurrence of these extreme weather events as being due to climate change?”. To explain this, it’s important to understand that the concept “climate” refers to a 30-year average of the weather. Climate change thus represents a shift of this average compared to the past. But it is not only the average temperature that is shifted. In order to understand this, observe the figure below.
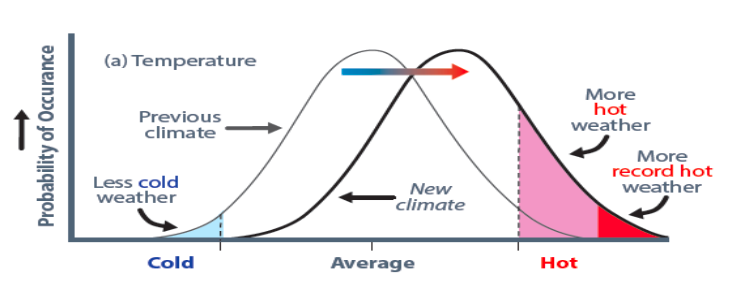
In this image, we can see the (schematic) distribution of the daily temperature recorded in a given location during one year. Climate change shifts the distribution to the right, leading to a minor change in the average annual temperature (which corresponds to the peak of the distribution). For the Netherlands, this shift represents the change from 9oC in the old climate to 11oC in the present climate. More significant changes occur in the tails of the distribution. Due to climate change, substantially more extreme high temperatures (as represented by the increase in surface area below the right-hand tail of the distribution), while fewer extreme low temperatures will occur (as represented by the reduction in surface area below the left-hand tail of the distribution.). For example, a heat wave was something very rare in the past, but it is now happening more as the distribution shifts to the right. The same applies to other extreme weather events such as extreme precipitation, rain, droughts, forest fires and floods.
Climate change is a global phenomenon, and we have started to experience these extreme events all around the world. The increasing frequency and intensity of these extreme events tell us that something is happening now that didn’t happen in the past. In order to assess how much further the climate will change in the coming decades, the next section is devoted to elements of the results presented on this topic in the IPCC 6th assessment report.
The Intergovernmental Panel on Climate Change (IPCC) is a review organization set up by the World Meteorological Organization and the United Nations. Its scientists – brought together from all over the world – are charged with the task of collecting the most up-to-date insights from climate science and presenting them in an assessment report which is published every 6-7 years. These reports represent a double review; the scientific papers used as input have already passed the usual peer review process. The IPCC assessment effectively represents another round of review. This means that the report can be considered as the most credible scientific knowledge on climate change. The conclusions therefore have a very sound scientific basis.
The 6th Assessment Report, presented in August 2021, included many of the same subjects that we've covered in this article - sea level rise, extreme weather events and melting of ice. But it also included the very important observation that changes in CO2 levels are not easy to stop, which is needed in order to stop climate change and reduce its consequences. Even if we stopped CO2 emissions today, the climate will continue to change for decades because previously emitted CO2 molecules will typically stay in the atmosphere for up to 100 years. Moreover, past CO2 emissions have disrupted the equilibrium between oceans, CO2 levels, temperatures, and vegetation. Even if we stop distorting the equilibrium, it will take centuries before it is restored. This is why some scientists categorize climate change as irreversible. These changes will remain for many centuries; it could take as much as 2000 years before everything is reverted to its former balanced state. That is one of the conclusions from the IPCC-AR6 report: an “unprecedented scale of changes in climate for thousands of years”.
Another conclusion from this report is the “unequivocal human influence on global warming”. The word “unequivocal” means that there is no doubt that climate change is caused by the action of human beings. This is a dramatic conclusion for a scientific report, as scientists are accustomed to more conservative affirmations such as “it's extremely probable” or “with all margins of uncertainty”. This conclusion is thus the most dramatic ever published by the IPCC.
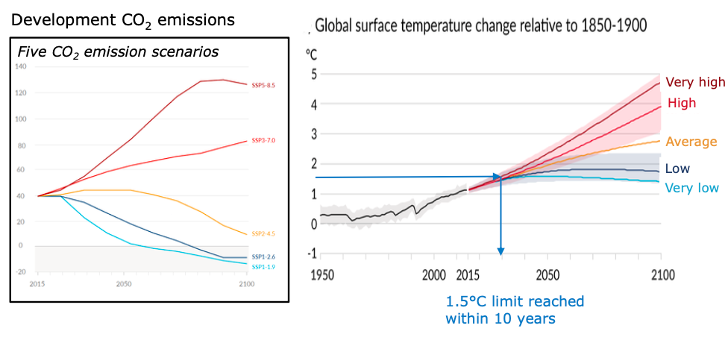
Crucially, the report also states that “global warming will go beyond the limits set by the Paris Agreement of December 2015 unless extreme reductions in greenhouse gas emissions occur”. Temperatures will rise by 1.5 degrees Celsius in all reasonable scenarios. This is further illustrated in the figure below.

Whichever model we use, the 1.5 Celsius degree limit of the Paris Agreement is reached in the early 2030s. The reason is the same as was mentioned before: the long lifetime of CO2 in the atmosphere - meaning that, even in the most optimistic scenario, global warming will continue for several decades. From a scientific perspective, this conclusion is gratifying because we essentially know for sure when we will reach the 1.5oC limit. From a policy point of view, however, it's very worrying; it means that, whatever we do, it won't be possible to stay below the 1.5 Celsius degree mark on a short time scale. (On a longer time scale CO2 retrieval from the atmosphere might enable us to stay close to the 1.5oC limit – see the blue curve in the figure above).
So the effects of global warming created in the past decades will be with us for a longer period. But if we work very hard on reducing emissions, we may hope to stay within the limit of 2 degrees (or a bit less). We must stay close to the limits described by the Paris Agreement because many dangers will develop; from the increased probability of extreme weather events such as droughts and heat waves, to more remote events such as changes in the sea currents or the release of methane from the (normally frozen) land in Siberia. Furthermore, at a certain point, oceans and vegetation can reach a point of saturation. This means that if we continue increasing CO2 emissions according to the red curve in the previous graph, the absorption of CO2 – particularly in the oceans - will reach a point of saturation, resulting in a further increase of the effect of global warming.
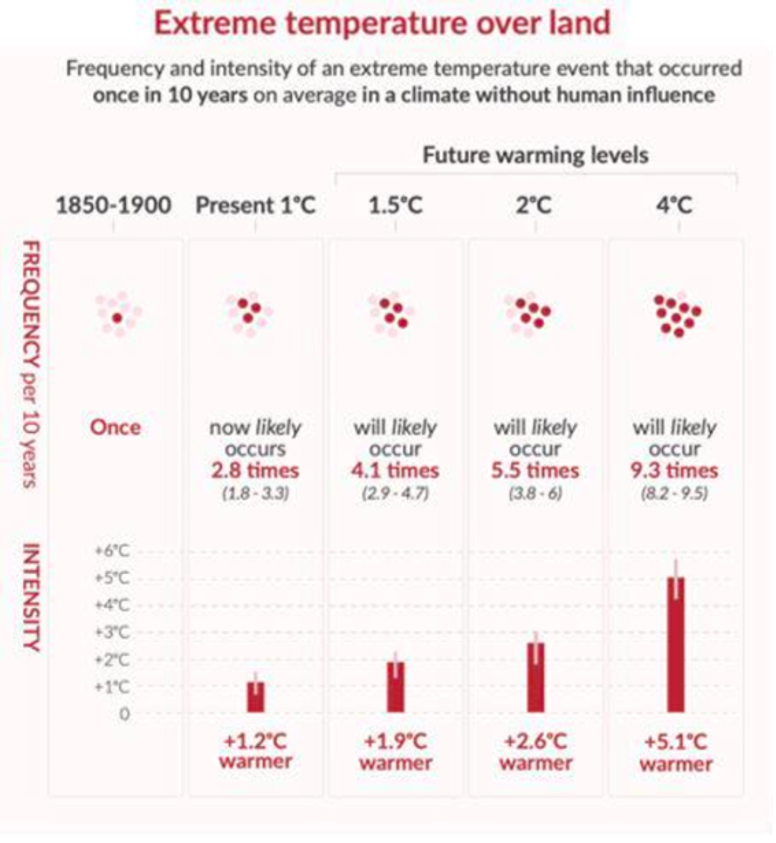
Additionally, according to the IPCC report, “extreme weather events will increase in intensity and frequency.” A potential increase in temperature correlates directly with an increase in extreme events, as we can observe in the graph below.

In the present climate, which has already warmed up 1.2 degrees, an extreme event will occur 2.8 times more frequently than in the past. This is quite dangerous, as heat waves are the deadliest extreme weather events that we know of. When a flood occurs, everyone loses their possessions and there is a lot of damage, but people often have enough time to leave their houses and their cities; when there is a heatwave, it’s more difficult to move to other areas. This makes heatwaves very lethal in most regions of the world.
The 6th IPCC Assessment Report also raises awareness about tipping points. As we mentioned when discussing sea level rise, a tipping point would be reached if an Antarctic ice sheet breaks and slides into the oceans because of the precipitation on the top and undercurrents of warm water. But there are also tipping points related to changes in the sea water circulation. For instance, circulation in the oceans brings warm water from the Caribbean to England and to Norway, and temperatures are therefore rather moderate in this part of the world. There are indications that, at a certain tipping point, this conveyer belt might stop or reduce its speed, and a counterintuitive effect would take place, with temperatures in Europe going down while the worldwide temperatures go up. A tipping point in circulation changes can be very threatening because that would change the entire systematics of how the environment works. This IPCC Report admits that we don't know the exact possibility of the likelihood of occurrence of these tipping points.
When the 6th IPCC Assessment Report was published in 2021, the Royal Netherlands’ Meteorological Institute (KNMI) published a “Climate Signal” report which was offered to the State Secretary of the Environment by Gerard van der Steenhoven, the director general of the institute at that time. The report describes the consequence of the IPCC report for the Netherlands. Apart from that, some results of more recent research were also included; the effect of several extreme weather events, such as those mentioned before in British Columbia and in the border region between Germany, Belgium and the Netherlands. In these cases, the weather systems stayed in one spot for several days, increasing the damages and losses. The new result is that this stability of the weather system can possibly be attributed to the jet stream that is meandering more strongly than it used to. And this in turn might be explained by the decrease in temperature difference between the North Pole and the Equator. If these wiggles occur, extreme weather events may stay put for several days until the system starts moving again.
For some of the public, the question of whether extreme weather events are a result of random fluctuations of the weather or of climate change is up for debate - not for scientists. In the past, linking an individual event to climate change was virtually impossible. However, scientists of the University of Oxford, the Royal Netherlands Meteorological Institute (KNMI), the University of Melbourne, and the Red-Cross/Red-Crescent Climate Centre developed the so-called weather attribution technology which enables them to determine whether an extreme event can be associated with climate change.
How does it work? As an example, let’s look at the extreme temperatures, such as the 40+ degrees recorded in the Netherlands on July 25, 2019, which had never been observed before. With this information, researchers put all the maximum temperatures recorded in the Netherlands since 1901 as a function of their recurrent frequency. In this case, they calculated that it is an event taking place once around every 1000 years. The higher the temperature, the rarer the event. Researchers then carried out climate model calculation trying to reproduce these data, using the CO2levels of the past and those of today. If the model with the increased CO2 levels reproduces the present data, another model run with the CO2 levels of the past shows – in the same graph – how much lower the probability of such an extreme weather events was in the past. If there is a substantial (and significant) difference between the old and present frequency of occurrence, one can state that the observed extreme weather event can – at least partially – be attributed to climate change. Note that in some of these analyses no difference is found, and in those cases – which have been reported as well – the association with climate change cannot be made.
The creation of this technology and public reporting of the results helps to increase the public awareness about climate change. In this way, more public support for the measures that need to be taken to fight climate change is generated.
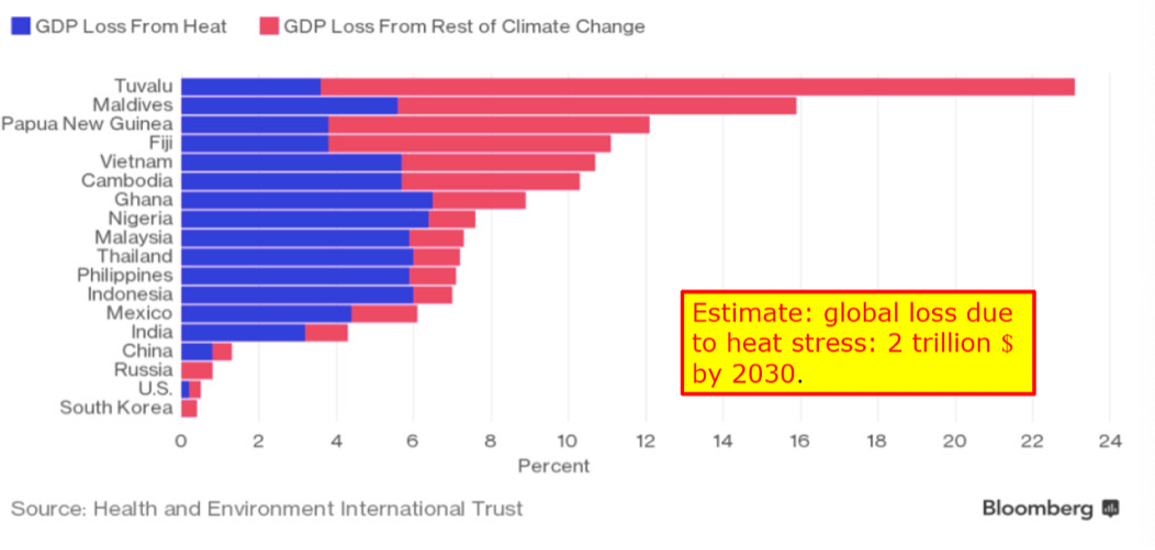
In 2016, the Health and Environment International Trust estimated the loss in terms of gross domestic product (GDP) due to climate change, focusing in particular on the effect of heat waves. The biggest impact is on small islands in the pacific such as the state of Tuvalu, where the losses are already at the level of around 23% of the GDP. Tuvalu, the Maldives, Fiji, and other names that appear in the figure below are all small island states in the Pacific. In the case of Tuvalu, it has an average altitude of only about 50 centimeters above sea level. Even with a high tide or a small storm, the citizens of Tuvalu island may already suffer from a 20 centimeters sea level rise. For that reason, New Zealand is the first country to officially issue visas for the refugees that need to leave their home country due to the effects of climate change.

It will be very difficult to protect such islands with a very small population and a small gross national product against sea level rise. That's why, in the Paris Agreement of 2015, the small island states pushed for a maximum temperature rise of 1.5 degrees instead of 2 degrees, as was stated at the beginning of the Agreement.
The example described in the previous paragraph is only one of many demonstrating the enormous impact that climate change will have on our societies. The report of IPCC Working Group II – which is part of the IPCC 6thAssessment Report published in 2022 – contains many further examples. The general recommendation is that by taking early - and where possible, local - action the effects of climate change can be reduced.
As we have seen in this article, there is unambiguous scientific evidence that the global climate is changing. As a result, essentially all countries are suffering from global warming and the increased occurrence of extreme weather events – as we are experiencing everywhere in the world.
But what actions can we take to mitigate the influence of climate change?
Probably the most important recent action, in this respect, is the Paris Climate Agreement of 2015. This agreement is supported by essentially all countries worldwide, and is fully aligned with the United Nations Sustainable Development Goals, specifically SDG 13: Climate action. Climate actions are at the same time related to other SDGs such as clean water, global health and sustainable cities.
Climate policy measures for the future have three main components: mitigation, adaptation and awareness.
Climate mitigation is the name of all actions aimed at reducing CO2 emissions and the emission of other greenhouse gases, thereby reducing the rate at which the climate is changing and – in the end – hopefully stopping climate change. The second component is climate adaptation. It stands for all actions taken to reduce the effects that climate change has on society. Because we know climate change and its effects will be with us for at least 100 years - even if we stop emitting greenhouse gases immediately - we have to adapt as a society, e.g. by making larger dikes, protecting against heat waves, and making sure that people can cope with the consequences of elevated temperatures. To ensure that the general public supports all the measures that governments and individuals have to take, we need the third component, which is climate awareness.
Let’s take a look at mitigation. Coal production has increased over the last 100 years. It has only gone down slightly in the last couple of years of the previous decade. The same applies to natural gas and oil, which have gone up. These three – most widely used – sources of energy need to be replaced by energy sources that do not lead to the production of greenhouse gasses, such as nuclear, hydropower or renewable energies like wind, geothermal energy or solar panels. That's quite a challenge because these alternative energy sources each present their own issues – nuclear energy, for example, is very expensive; the installation of hydropower damages certain natural areas, possibly endangering rare biotopes. Furthermore, wind and solar energy have the disadvantage that they are weather dependent. For each country, these issues are weighed differently, implying that renewable energy does not receive the same support from all countries in the world. However, it should be stressed that, in order to mitigate climate change completely, all the fossil-energy streams that we use worldwide - such as transportation, production and heating – must be replaced in 30 years by renewables, with oil and gas reduced to a minimal amount. This means that society’s energy logistics have to change. In Europe, this work is essentially carried out by the European Commission in Brussels, where rules are being set for industry to make the transition to climate neutrality. However, the transition must come, not only for the industry but also for consumers, and that’s challenging as well.
Next is adaptation. Human beings are influencing climate systems, which also influences ecosystems and vice versa. The consequence is that policy measures for the climate, and those aimed at reducing the loss of biodiversity – for instance – are all interconnected. That is why various funding agencies are highlighting the importance of studying system transitions. In order to meet the requirements of a climate-neutral society, societies will be exposed to several system transitions: of our energy sources (obviously), our cities, our means of transportation, our health care systems, and more. This is an enormous challenge.
Despite these challenges, there is still some hope for solutions. We are seeing exponential growth in the number of solar panels, windmills on land and sea, and electric cars. Although the numbers in absolute terms are still very low, we are on the right track to achieving our goals.
If you look at a country like the Netherlands, which was for many years the worst country in the European Union in terms of CO2 footprint per capita, we can see that electricity production has already reached a level of 40% from renewables in 2022. However, electricity is only part of energy consumption. As a fraction of the total energy consumption, renewables represent 17% (in 2022) of the total. The fact that these numbers are going up is good news, but we are still not at 100%.
Climate awareness is also increasing. If we think about addressing climate change, we tend to think of climate policies, as a lot of work has to be done by governments. But there are local actions to be taken too. The book Drawdown by Paul Hawken collects 80 measures, identified by a group of American scientists, that can be taken to draw down CO2 emissions. They also assess the effectiveness of these measures in fighting climate change.
From switching to renewable sources of energy such as wind and solar panels, to daily choices of avoiding food waste or reducing meat consumption, there are many decisions that we can take as individuals to reduce CO2 emissions and create a positive impact on our environment. If we want to address a challenge as big as climate change, every action counts.

Login and start learning!